
Information Design
Transportation of Dangerous Goods Accident Data
Web & MOBILE
Web & MOBILE
The Overview
Here's the issue
The current issue is that the data being collected in relation to transportation of dangerous goods accidents is not valued as much as it should be. The members of the team working with inputing this data in the database system are not fully seen as valuable players as they should be for the work that they do.
I was hoping to change that with an impactful design on the statistics that they produce for the general public.
Here's the objective
The objective of this project is to not only inform users on the content, but to also engage them in the content/ statistics they are reading about.
The objective of this project is to not only inform users on the content, but to also engage them in the content/ statistics they are reading about.
Target audience
The target audience for this piece will be people of all demographics. This can include students that require these statistics for their studies, professionals in this field, or anyone looking to expand their knowledge in this realm.
Some background research
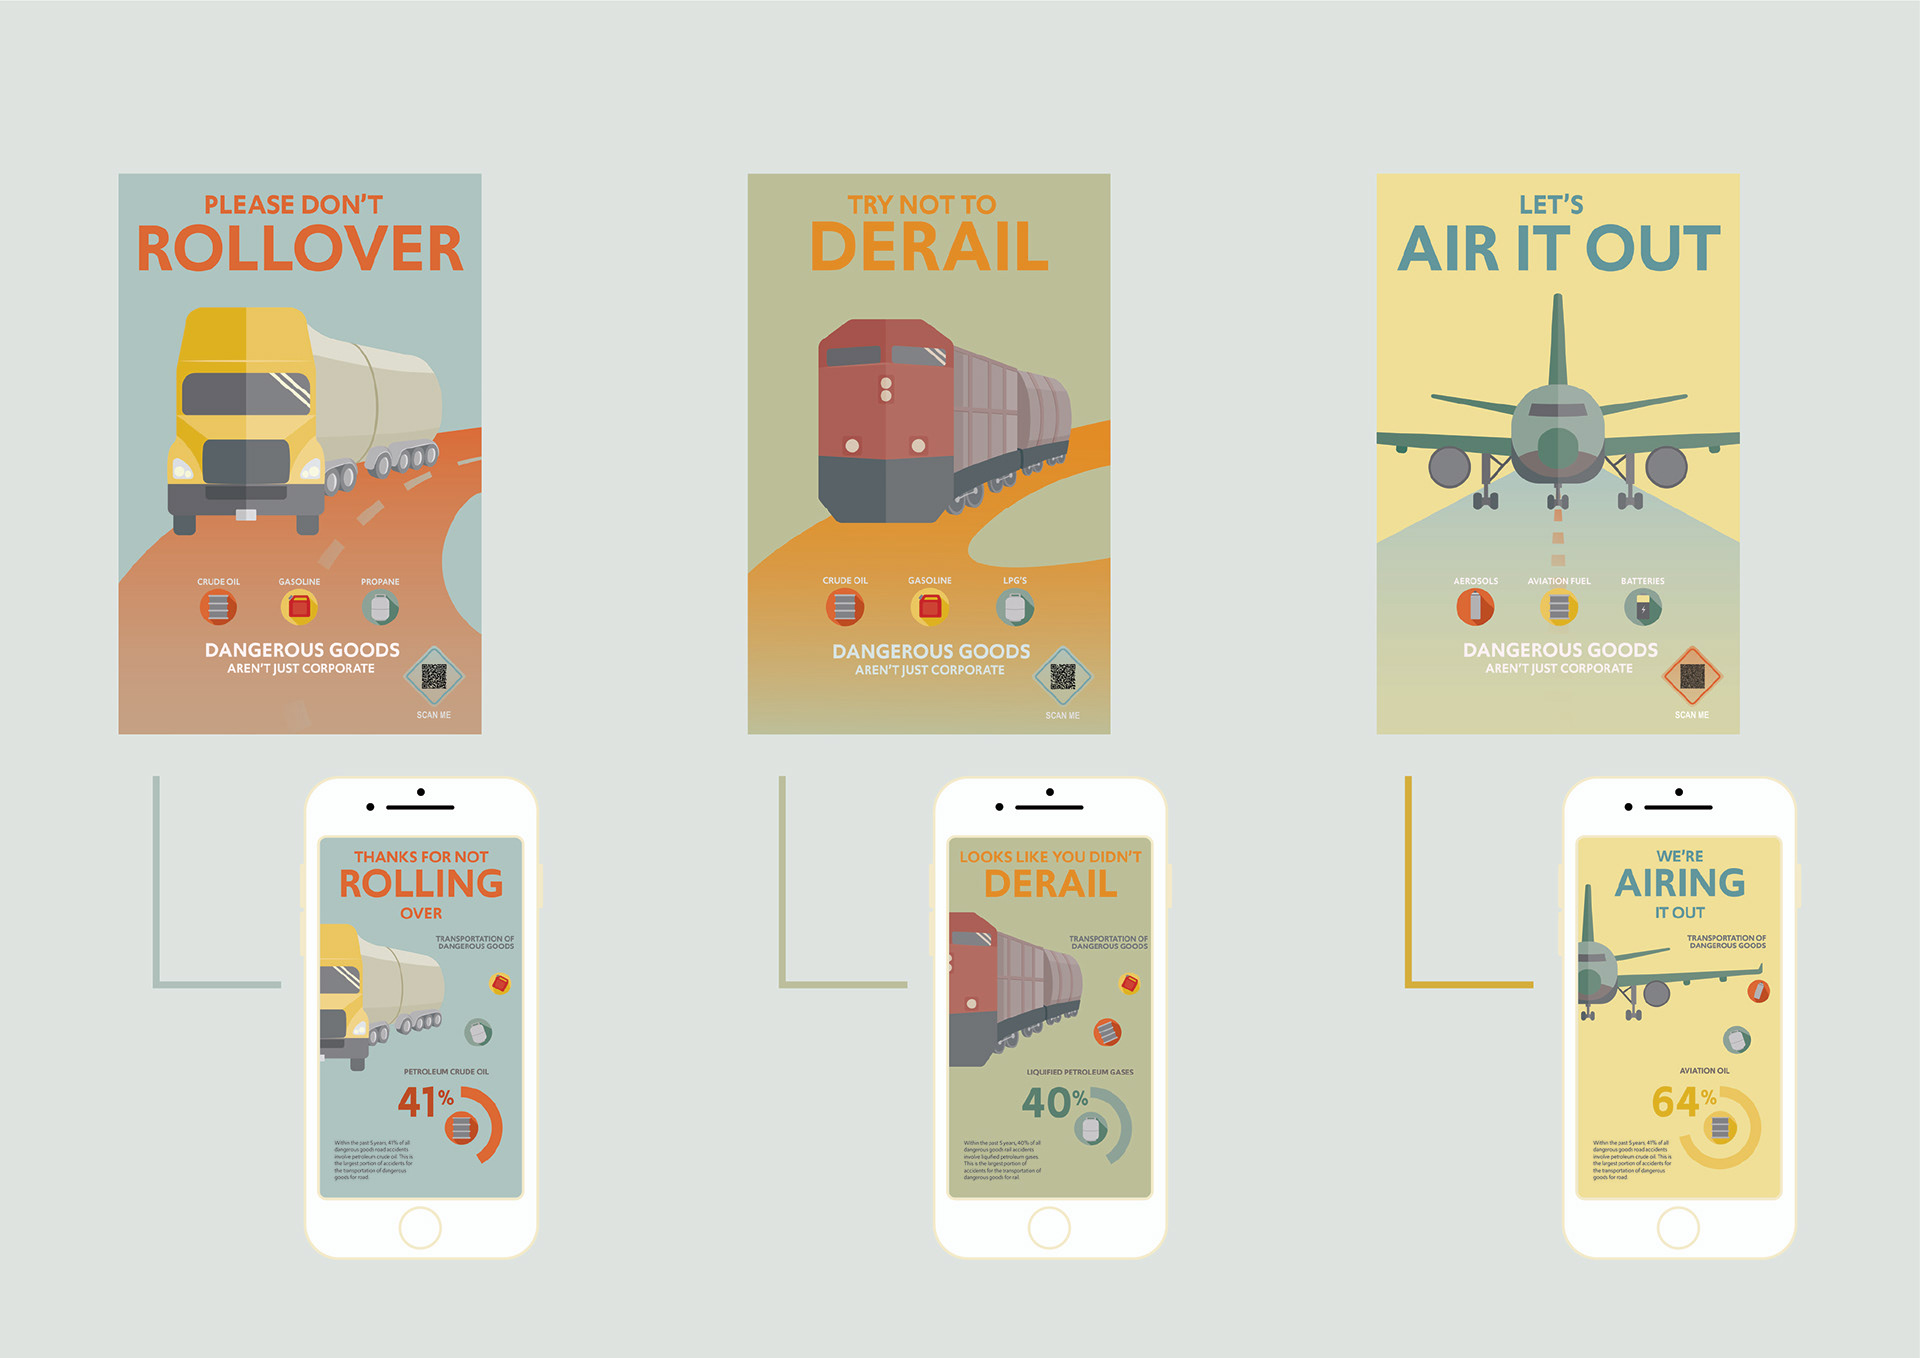
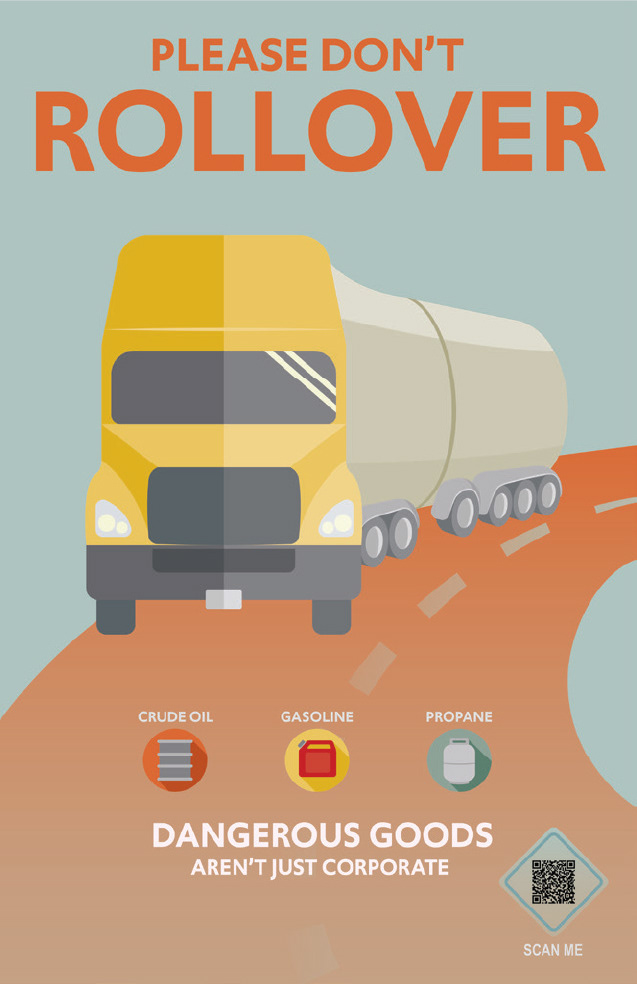
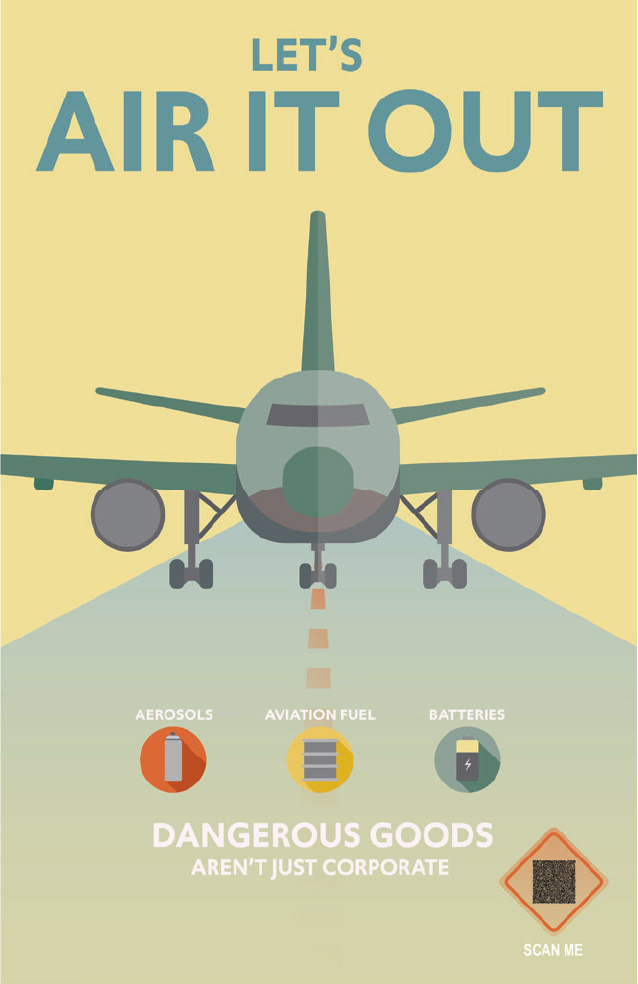
The statistics that were used as content for the design were taken from the Statistics Canada website. The data was used to create a unique poster for each mode of transportation.
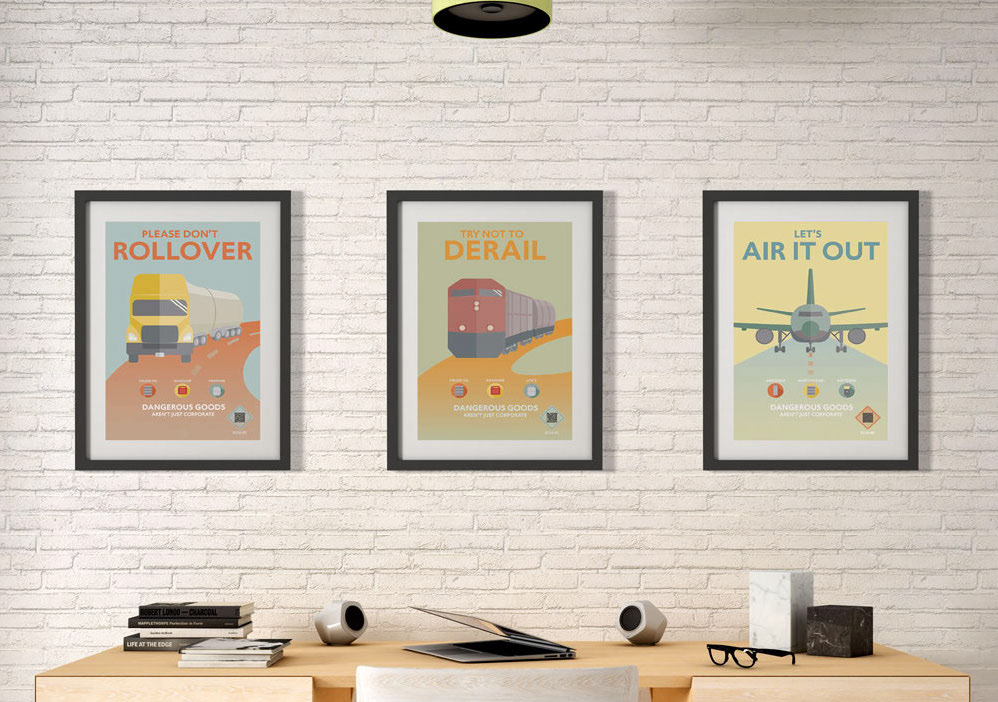
Mockup by yeven_popov on Freepik
The Outcome
Here's the result
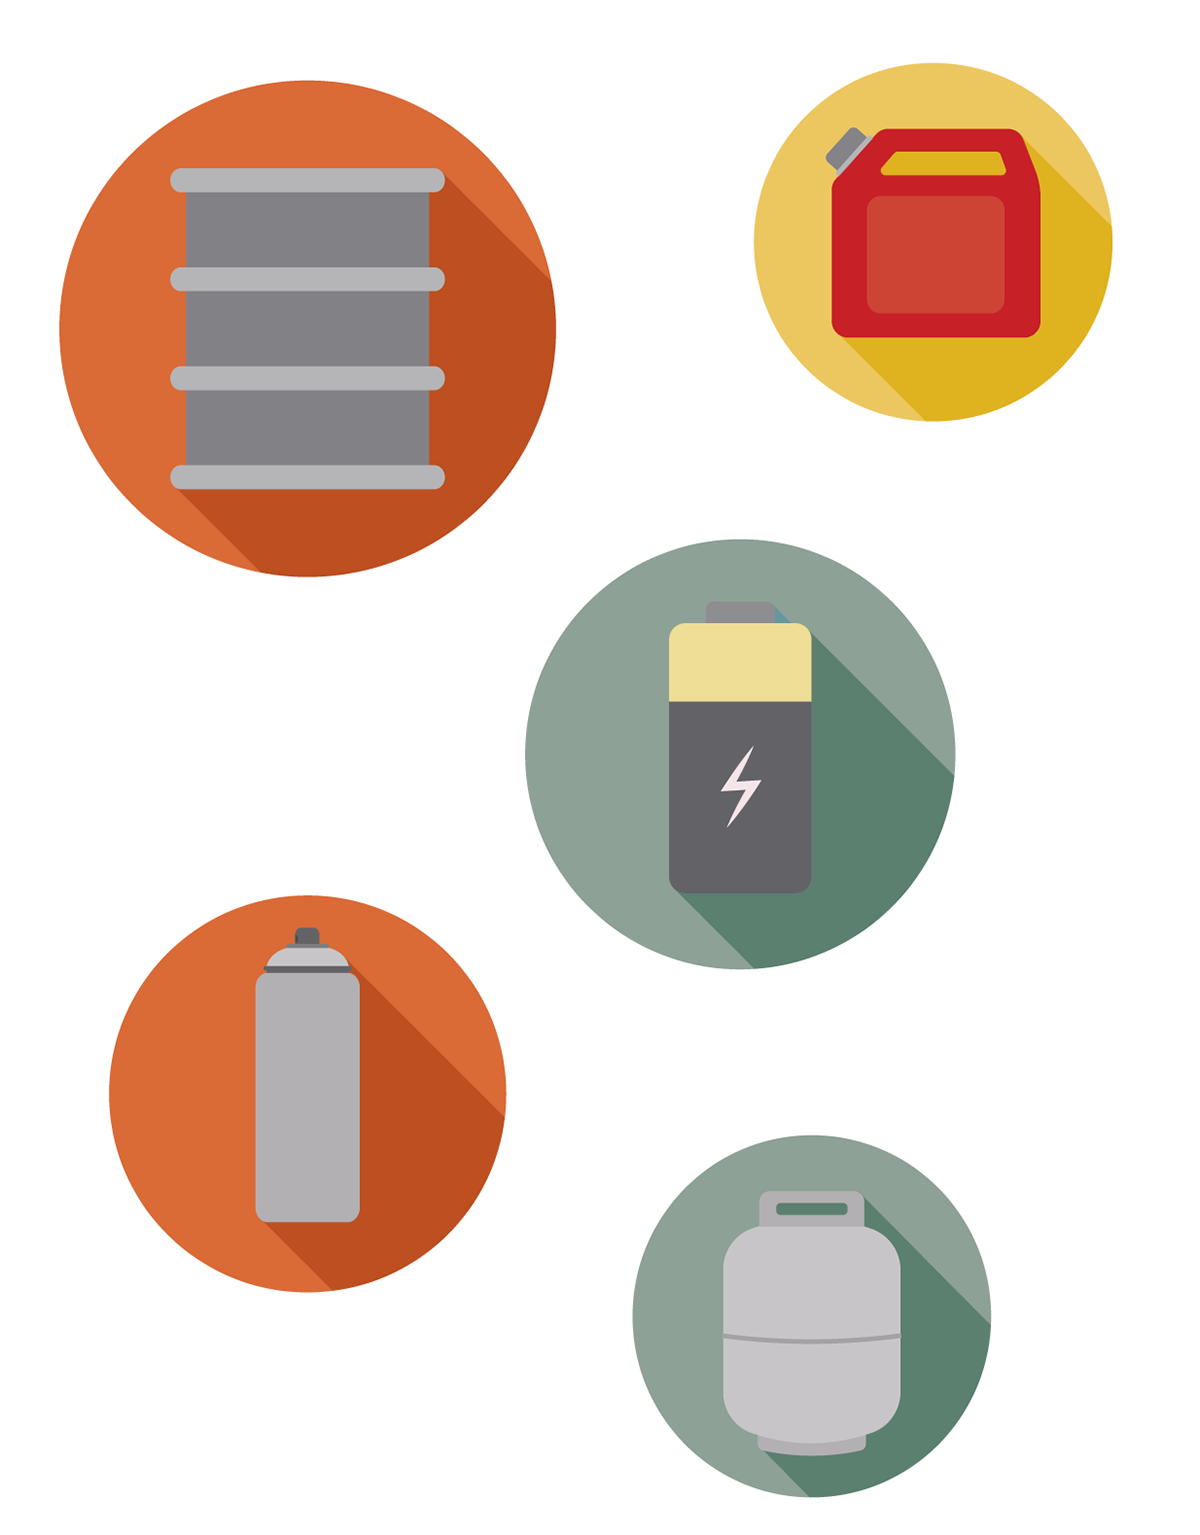
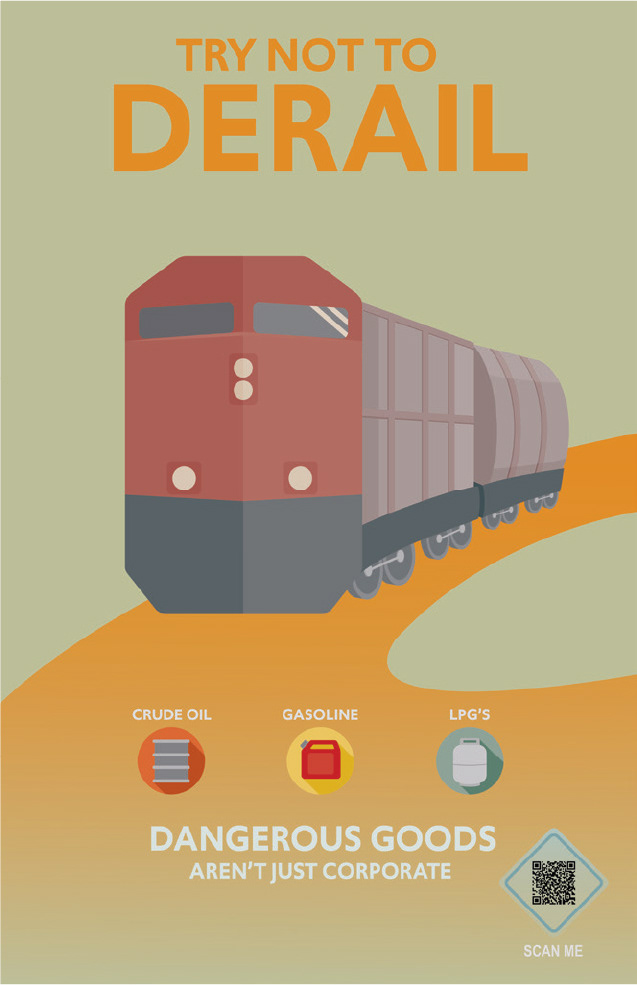
The final outcome of the project is an interesting and intriguing series of posters and landing pages. Each poster has a unique and quirky phrase that reflects the respective mode of transportation. Icons are placed throughout each poster as well that outline the products which are most common in respective dangerous goods accidents. Each poster is intriguing enough to capture the viewer’s attention and have them pull out their phones to scan the barcode (which will reveal more statistics of the data used in each poster).